Objectives
There are many usecases for which you want to apply machine learning to data. Whether you aim to extract insights or build powerful predictive models, understanding your objective is key.
Understanding vs. Predicting
Machine learning can be applied with two primary objectives in mind:
Explaining the data – You want to gain insights from the data to guide decisions or change policies.
Example: Which factors contribute most to customers leaving our service?
Making the best predictions – You want to use data to make highly accurate forecasts or automate tasks.
Example: Predicting customer churn with the highest precision
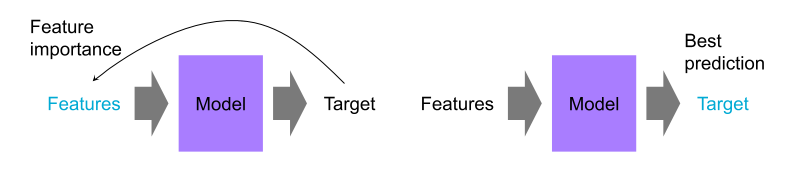
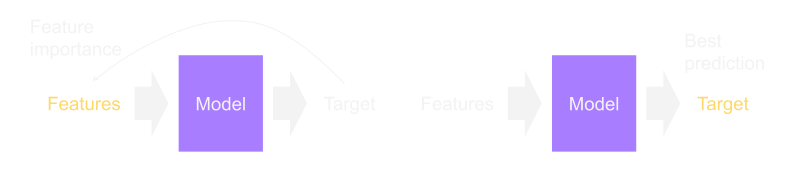
Some machine learning models, especially deep learning models, function as "black boxes." They may achieve high accuracy but provide little interpretability. While explainable models might perform slightly worse in prediction, they can be more valuable when understanding the underlying data is crucial.
Supervised vs. Unsupervised Learning
When you have a very specific target you want to predict with your model, you will probably need a lot of label data. However, this is not always possible or even the goal.
Supervised learning – You have labeled examples (input-output pairs) and want to train a model to predict labels.
Examples:
- Predicting if a customer will churn.
- Diagnosing diseases based on patient data.
- Estimating house prices based on features like location and size.
Unsupervised learning – You have no predefined labels and want to explore patterns in the data.
Examples:
- Grouping similar customers for targeted marketing.
- Generate a new sample out of an existing dataset. Like image generation.
Sometimes, semi-supervised learning is used when labeling data is expensive. This approach combines a small amount of labeled data with a large amount of unlabeled data to improve predictions.
Predictions
A major use of machine learning is to make predictions based on historical data. This can be broadly categorized into:
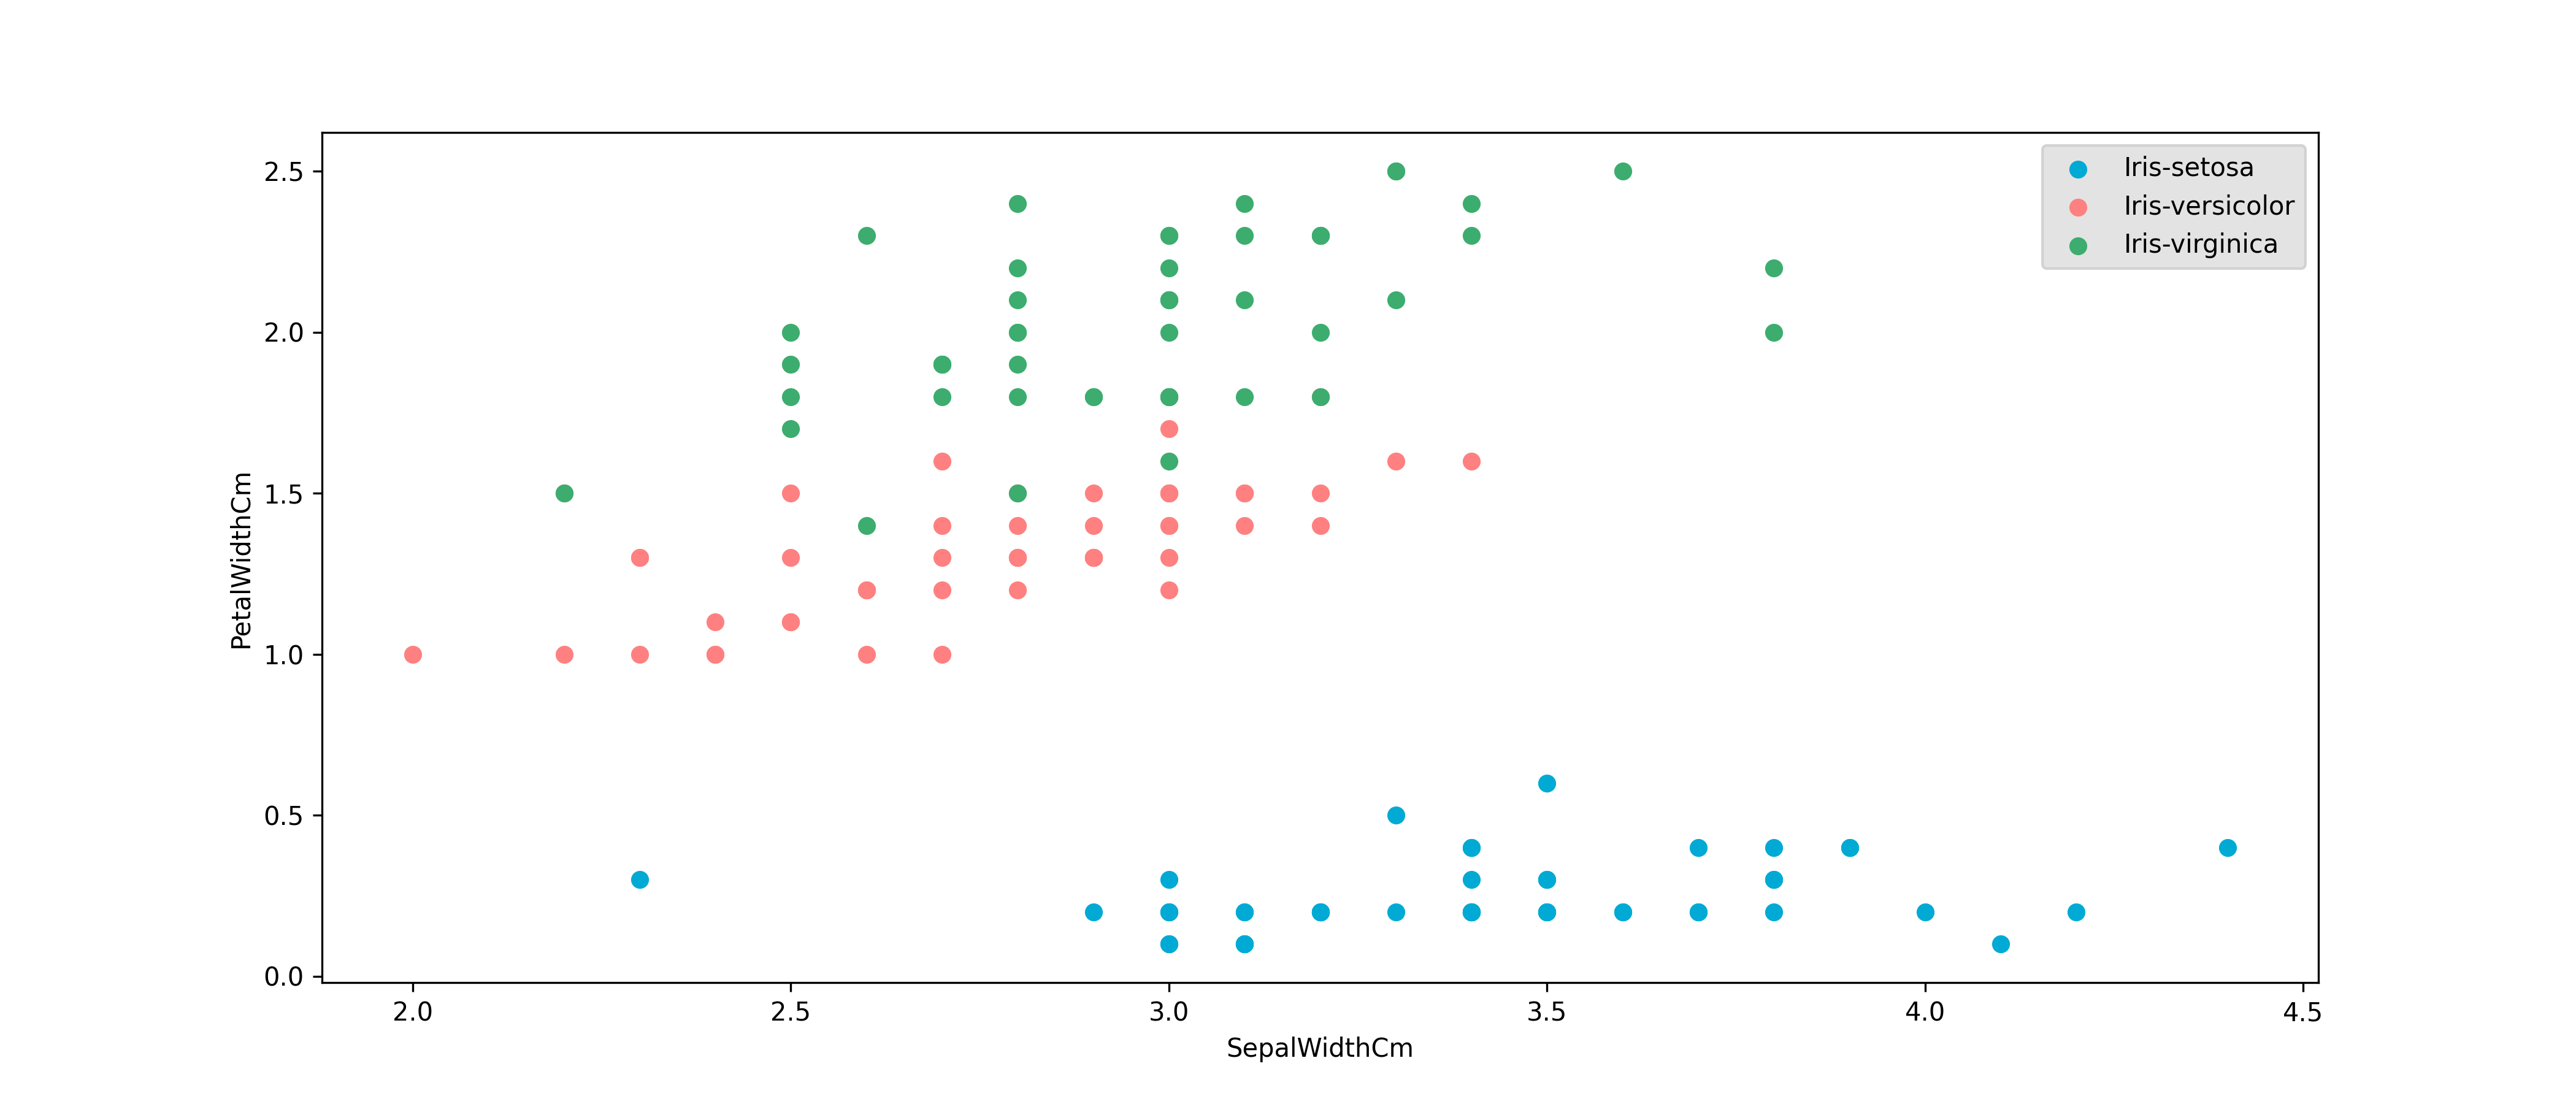
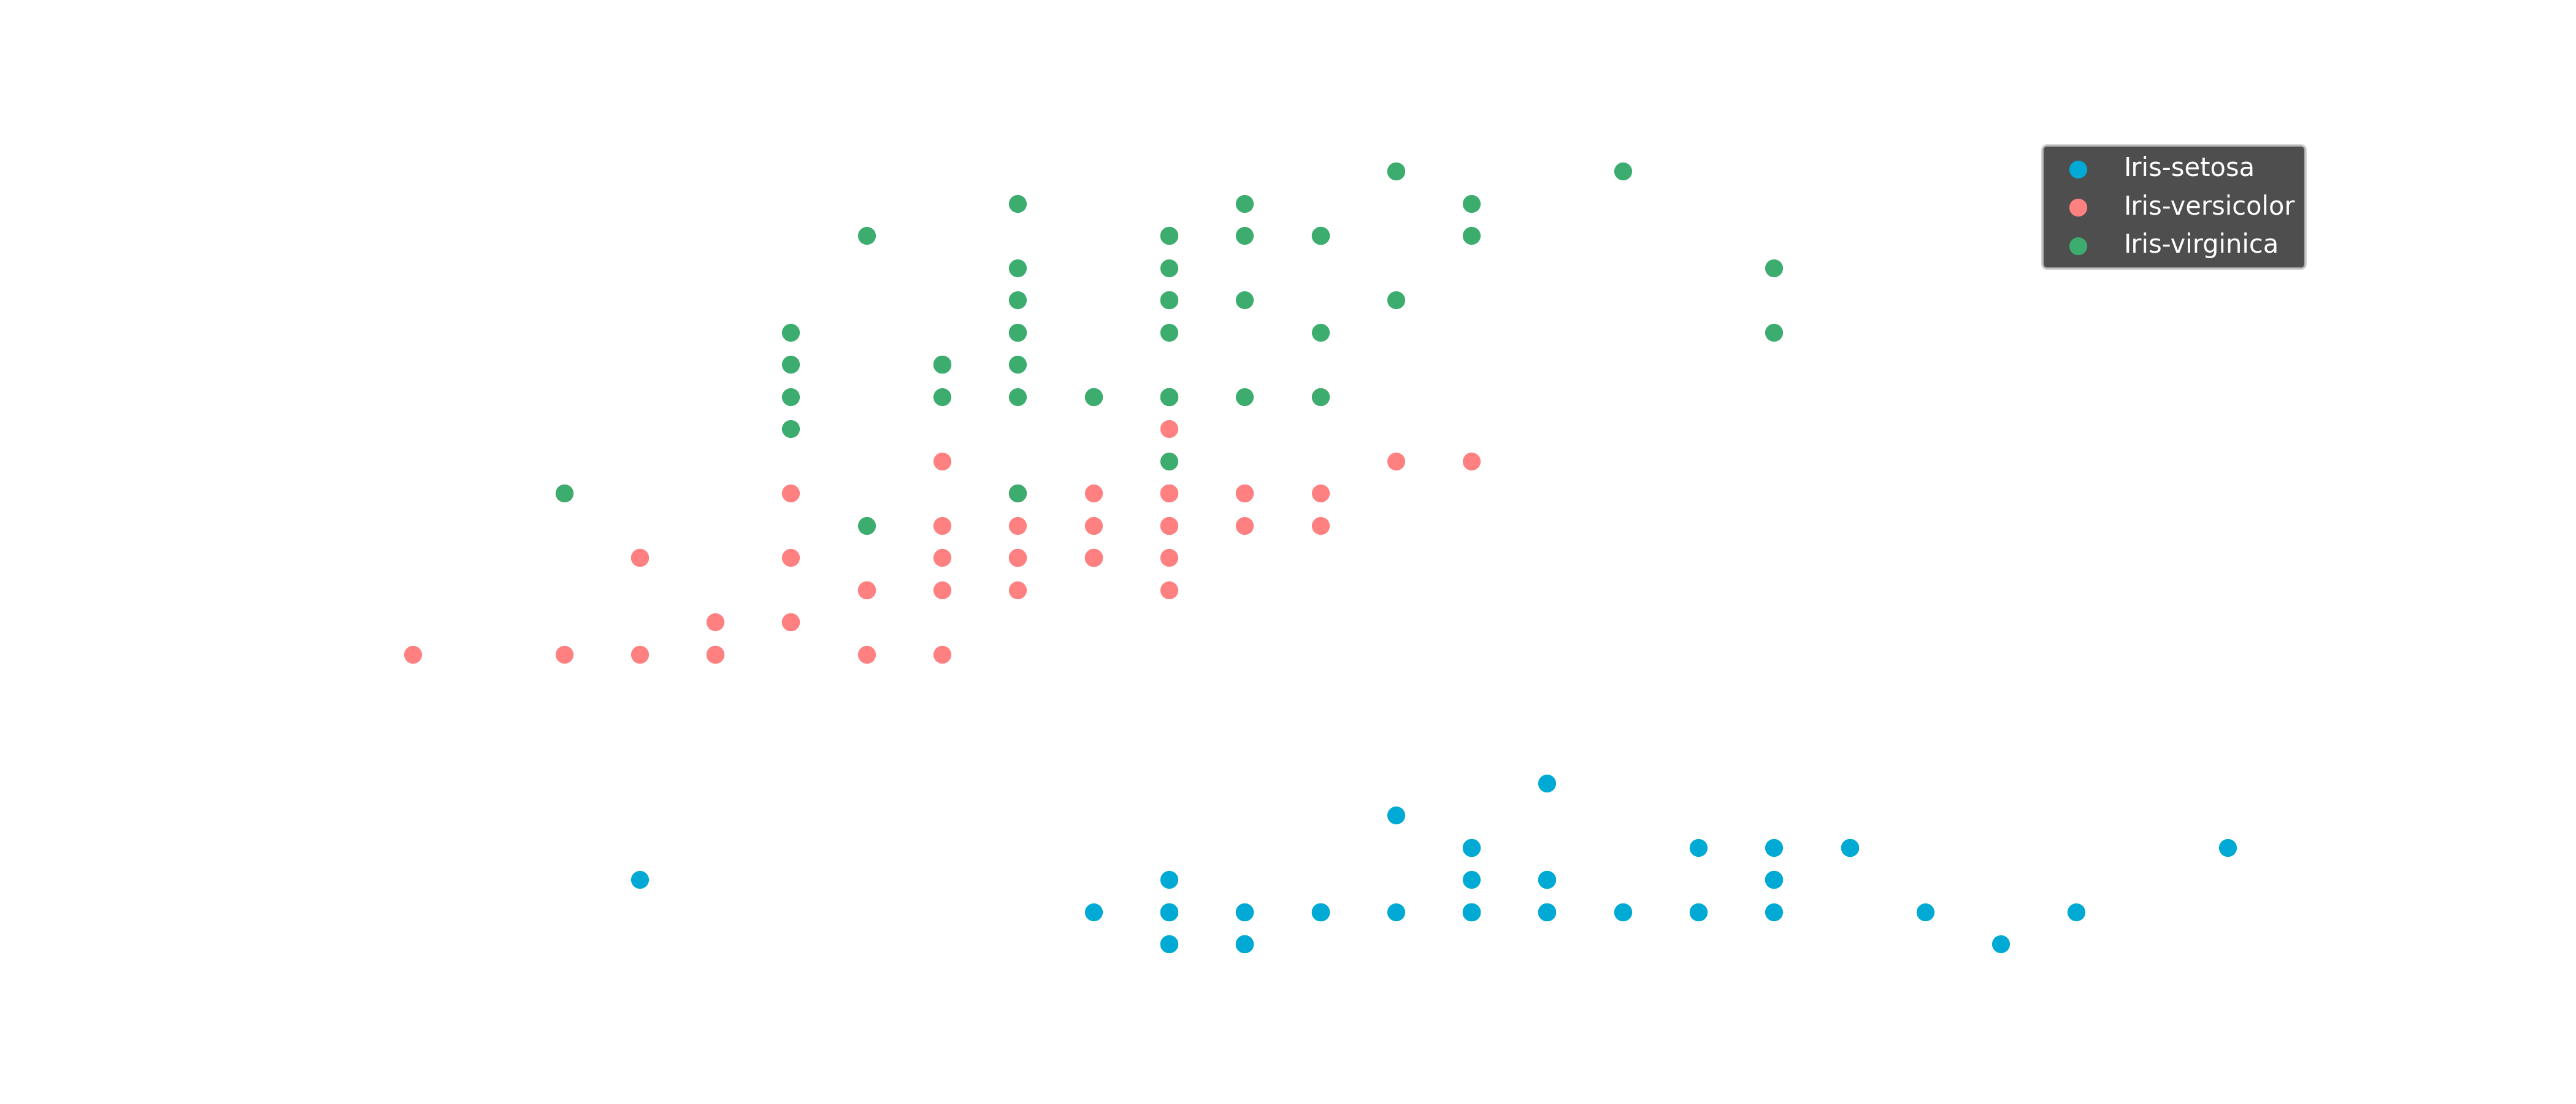
Classification
Classification models predict discrete categories based on input features.
For example, in the Iris dataset, we predict the species of a flower based
on its petal and sepal measurements.
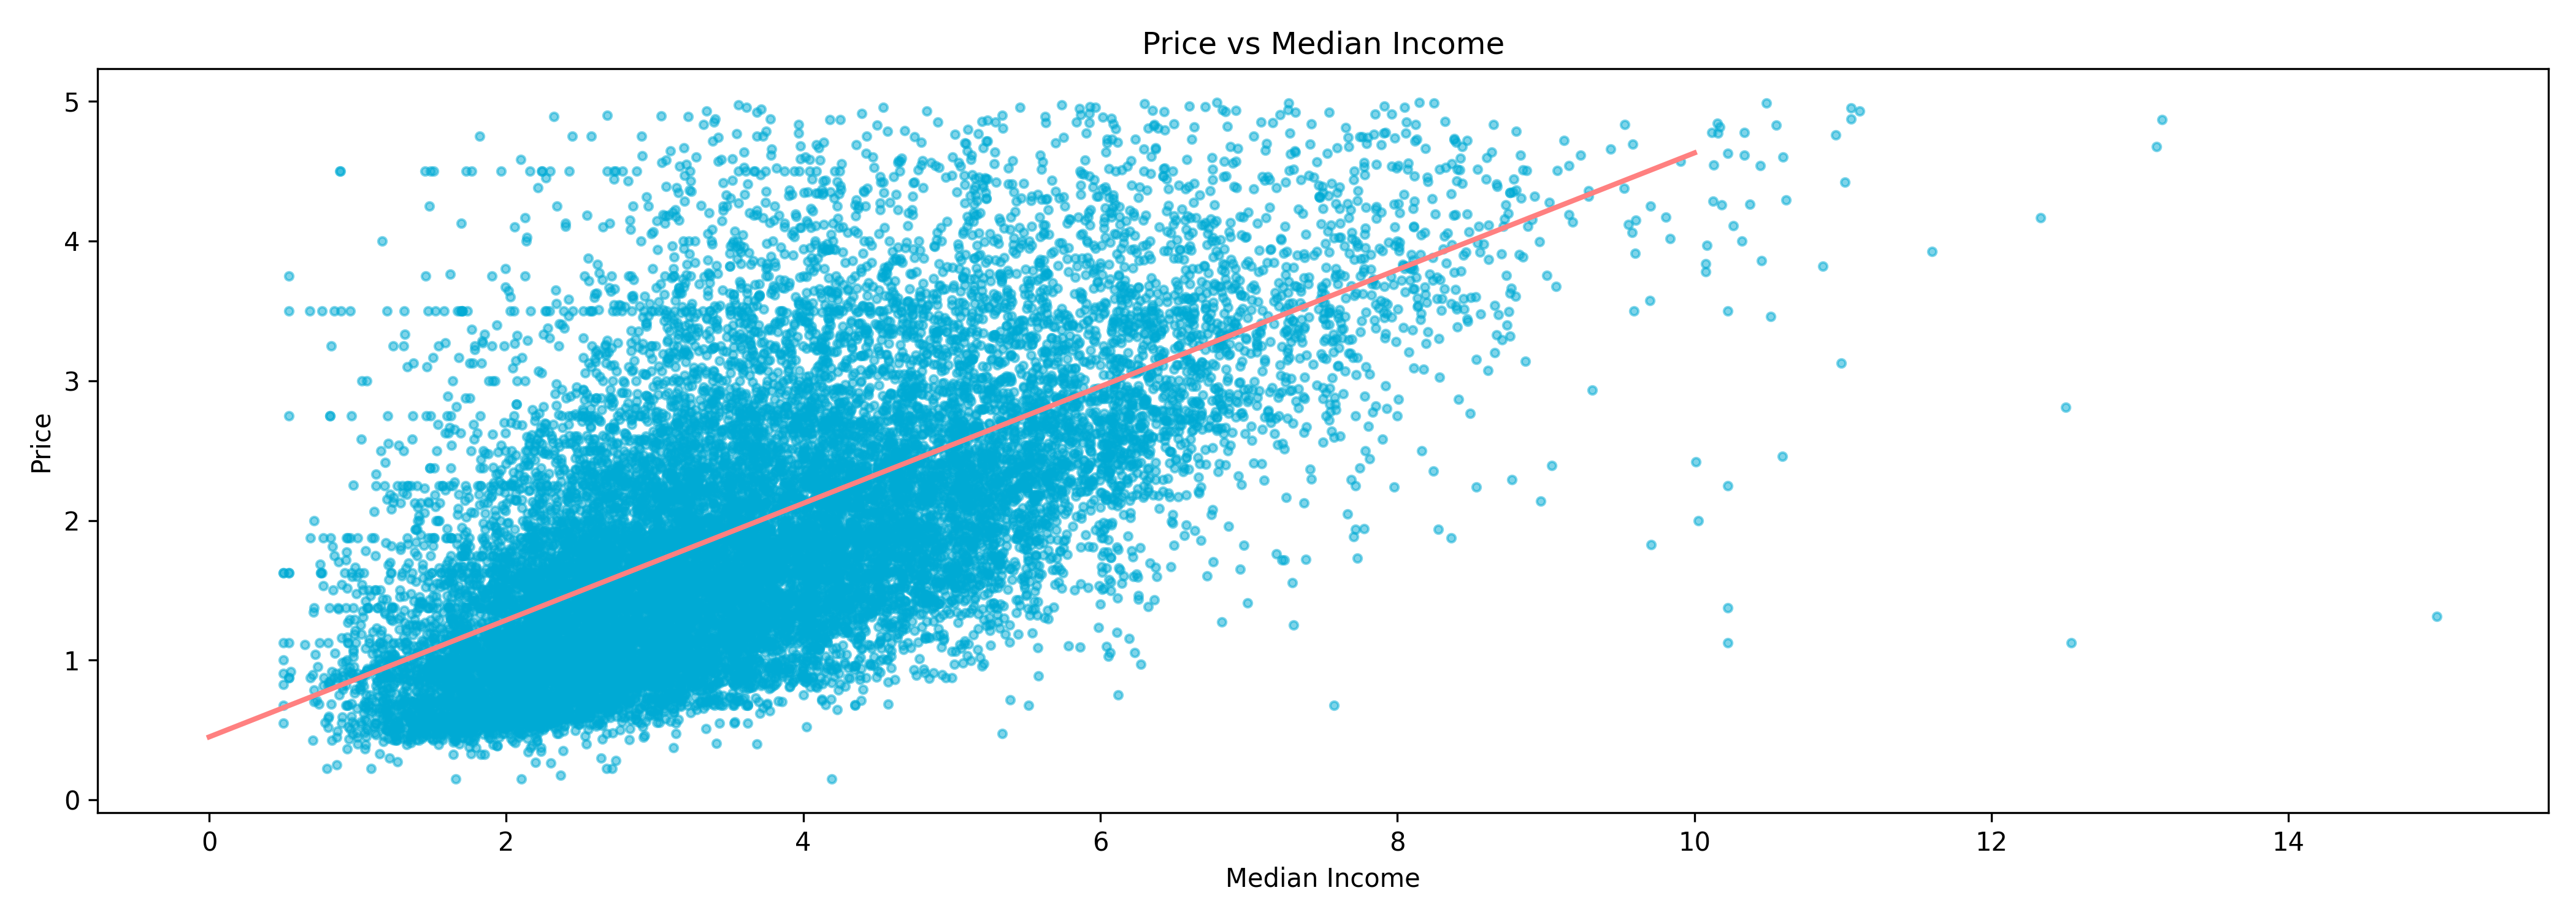
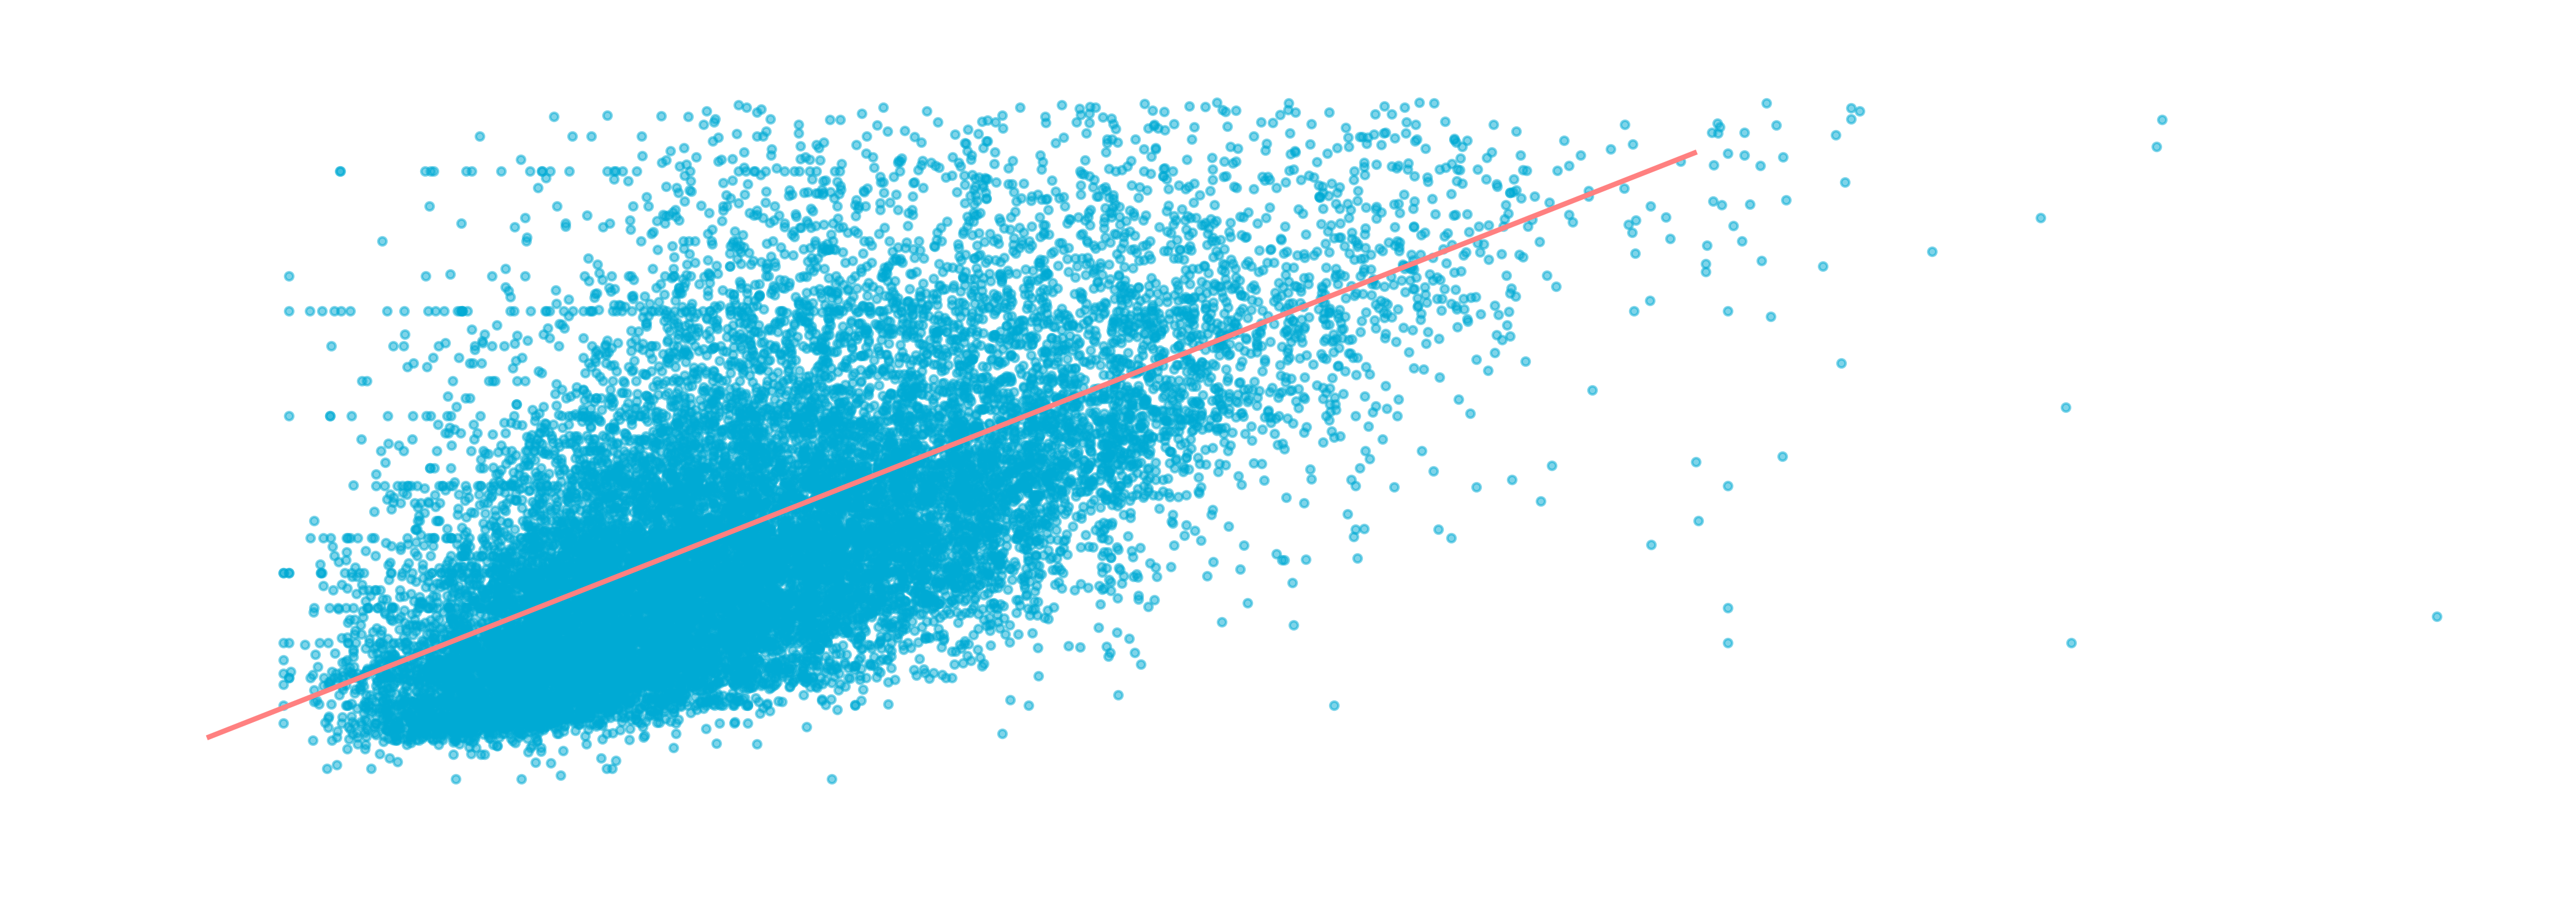
Regression
Regression models predict continuous numerical values instead of categories.
For example, estimating house prices based on features like location, square
footage, and number, average income of residents in the neighborhood of bedrooms.
Data Exploration
Machine learning is not just for prediction—it’s also a powerful tool for exploring and understanding data.
Clustering
Clustering algorithms group data points based on similarity.
For example:
- Customer segmentation – Grouping users for targeted advertising.
- Product recommendation – Identifying similar items based on purchase history.
Unlike classification, clusters do not have predefined labels. They need to be interpreted manually to understand their meaning.
It's also crucial to choose the right features for clustering.
For instance, eye color is probably irrelevant if you're trying to cluster customers based on shopping behavior.
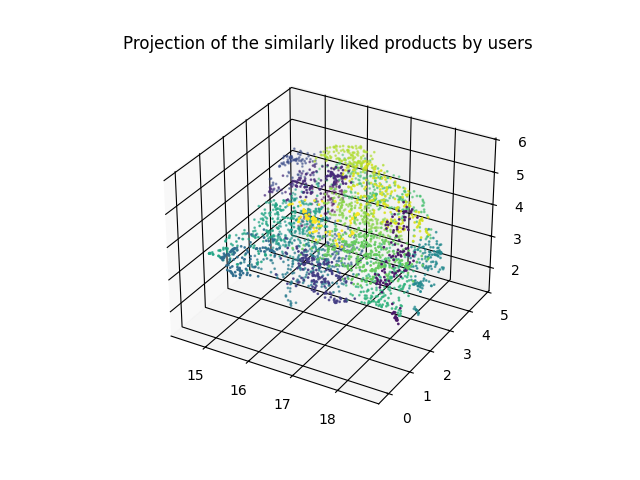
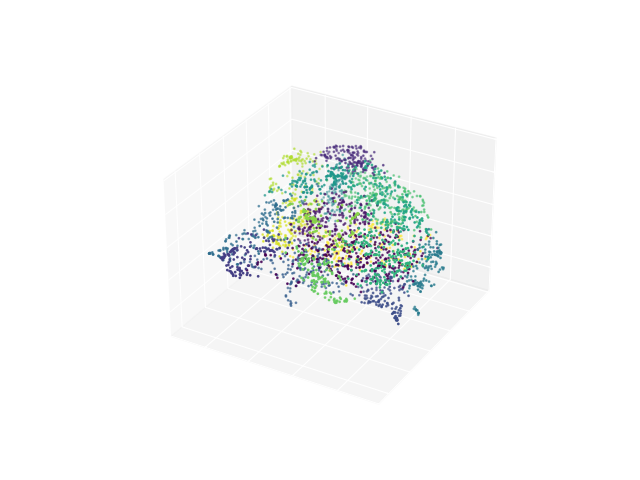
Dimension reduction
High-dimensional data can be difficult to interpret. Dimensionality reduction simplifies data by reducing the number of features while preserving its structure.
For example: Reducing 50 product categories to a few meaningful parameters to compare the similarity of products
Generative Models
Machine learning is also used for generation—creating new content that resembles existing data.
Examples include:
- Generating images (e.g., AI-generated artwork or faces).
- Creating synthetic training data when real data is limited.
- Text generation (e.g., chatbots and AI-powered writing assistants).
Recommendations
Recommender systems suggest relevant items to users based on their preferences and behavior.
For example:
- Content recommendations recommend content by for example YouTube, Netflix, Instagram and other streaming and social media services.
- Product suggestions suggest similar products or products like by similar users.
- Drug recommendations recommend a drug that worked well for other patients.
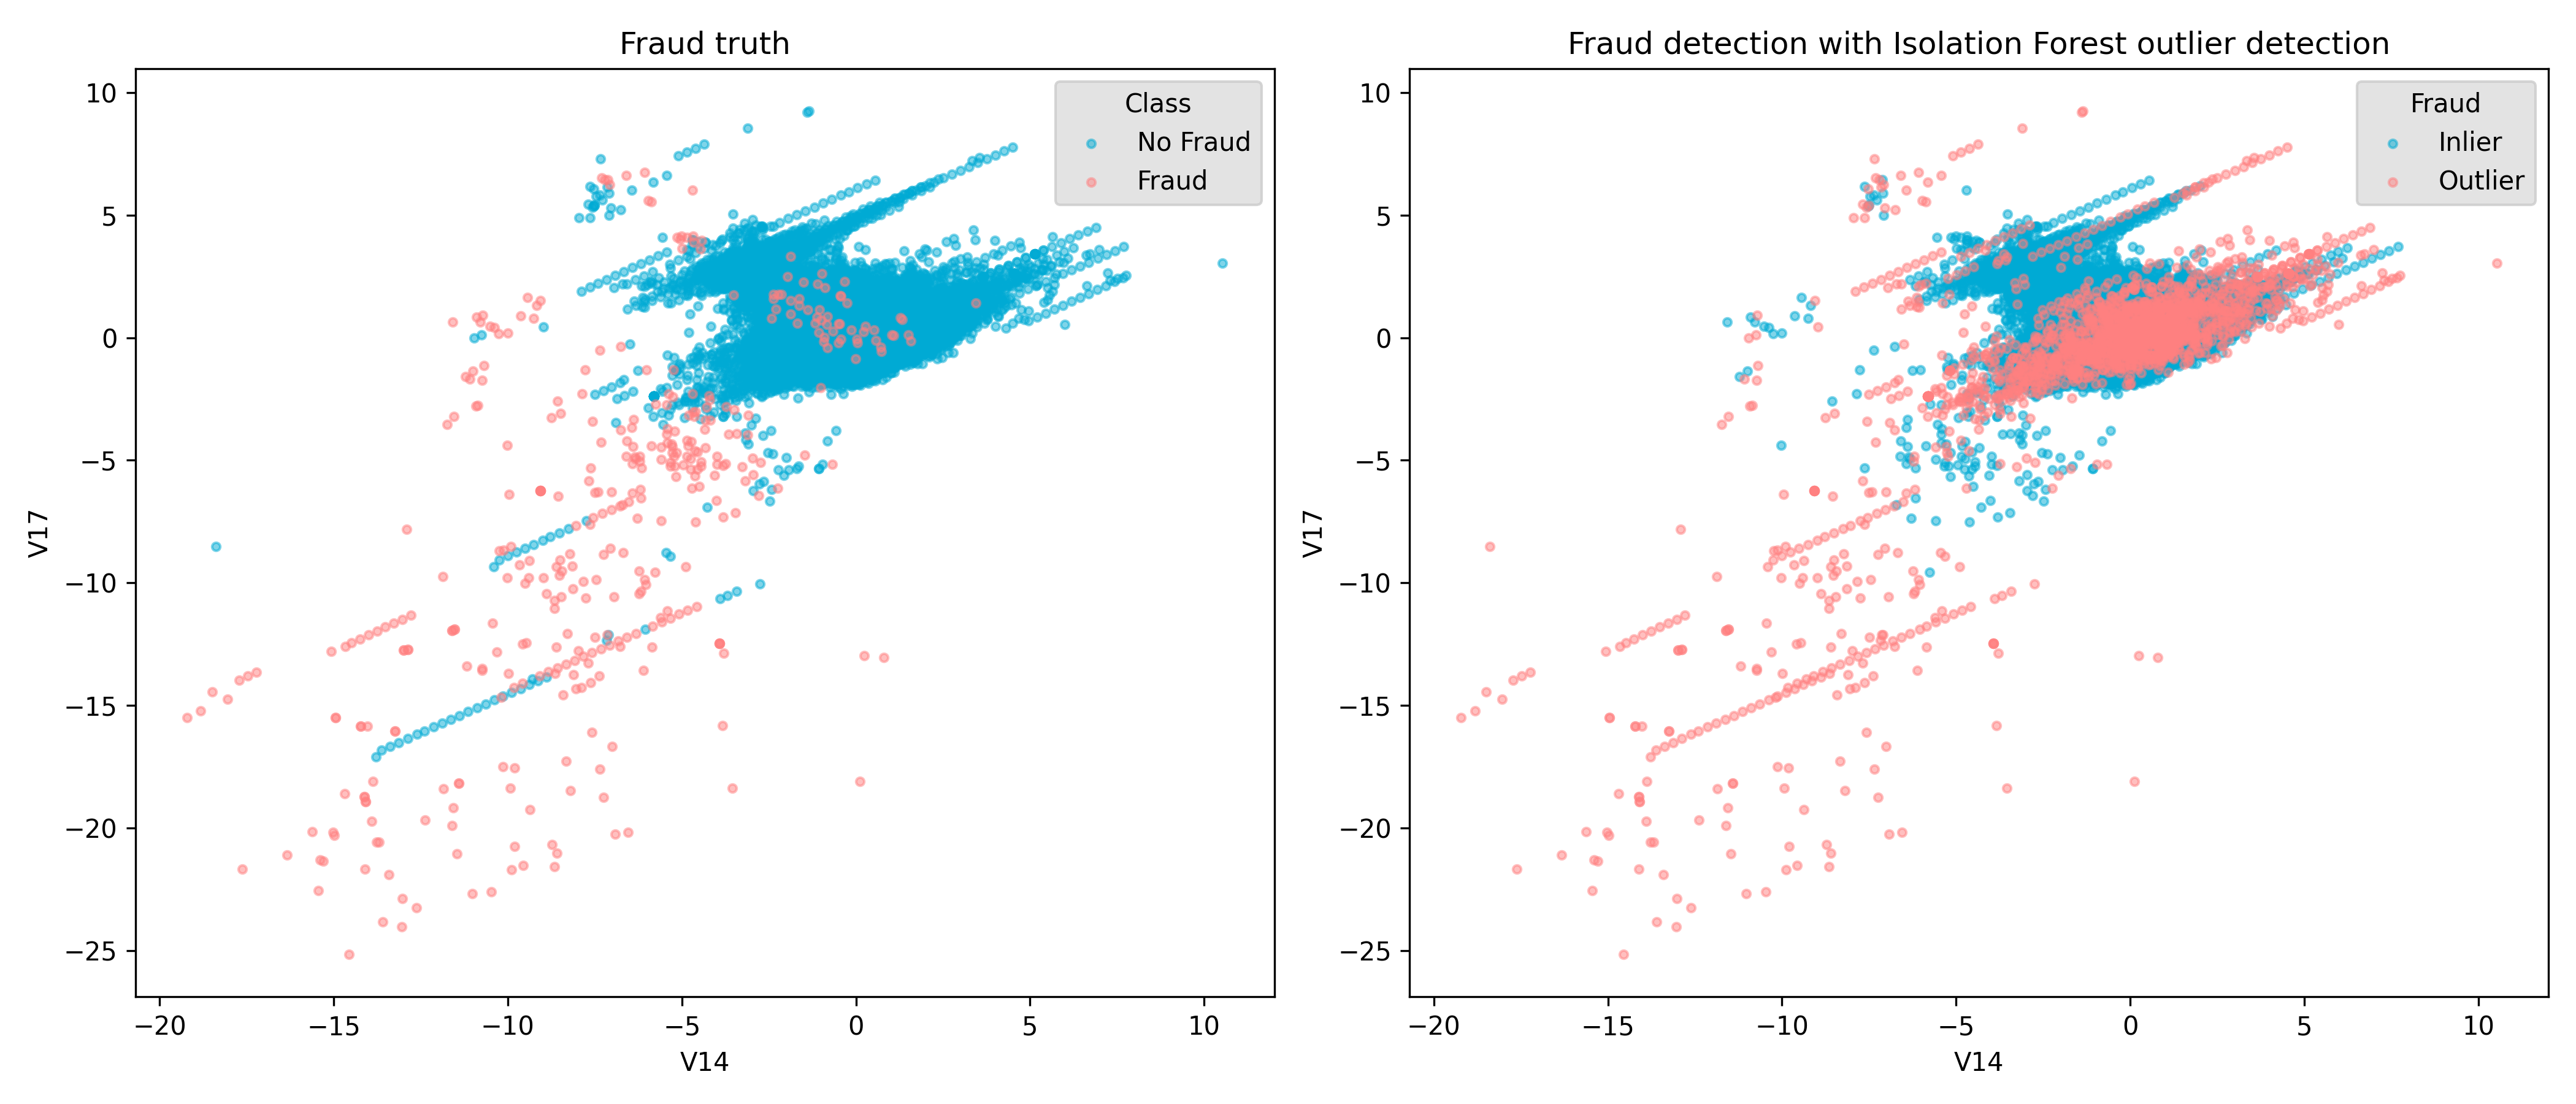
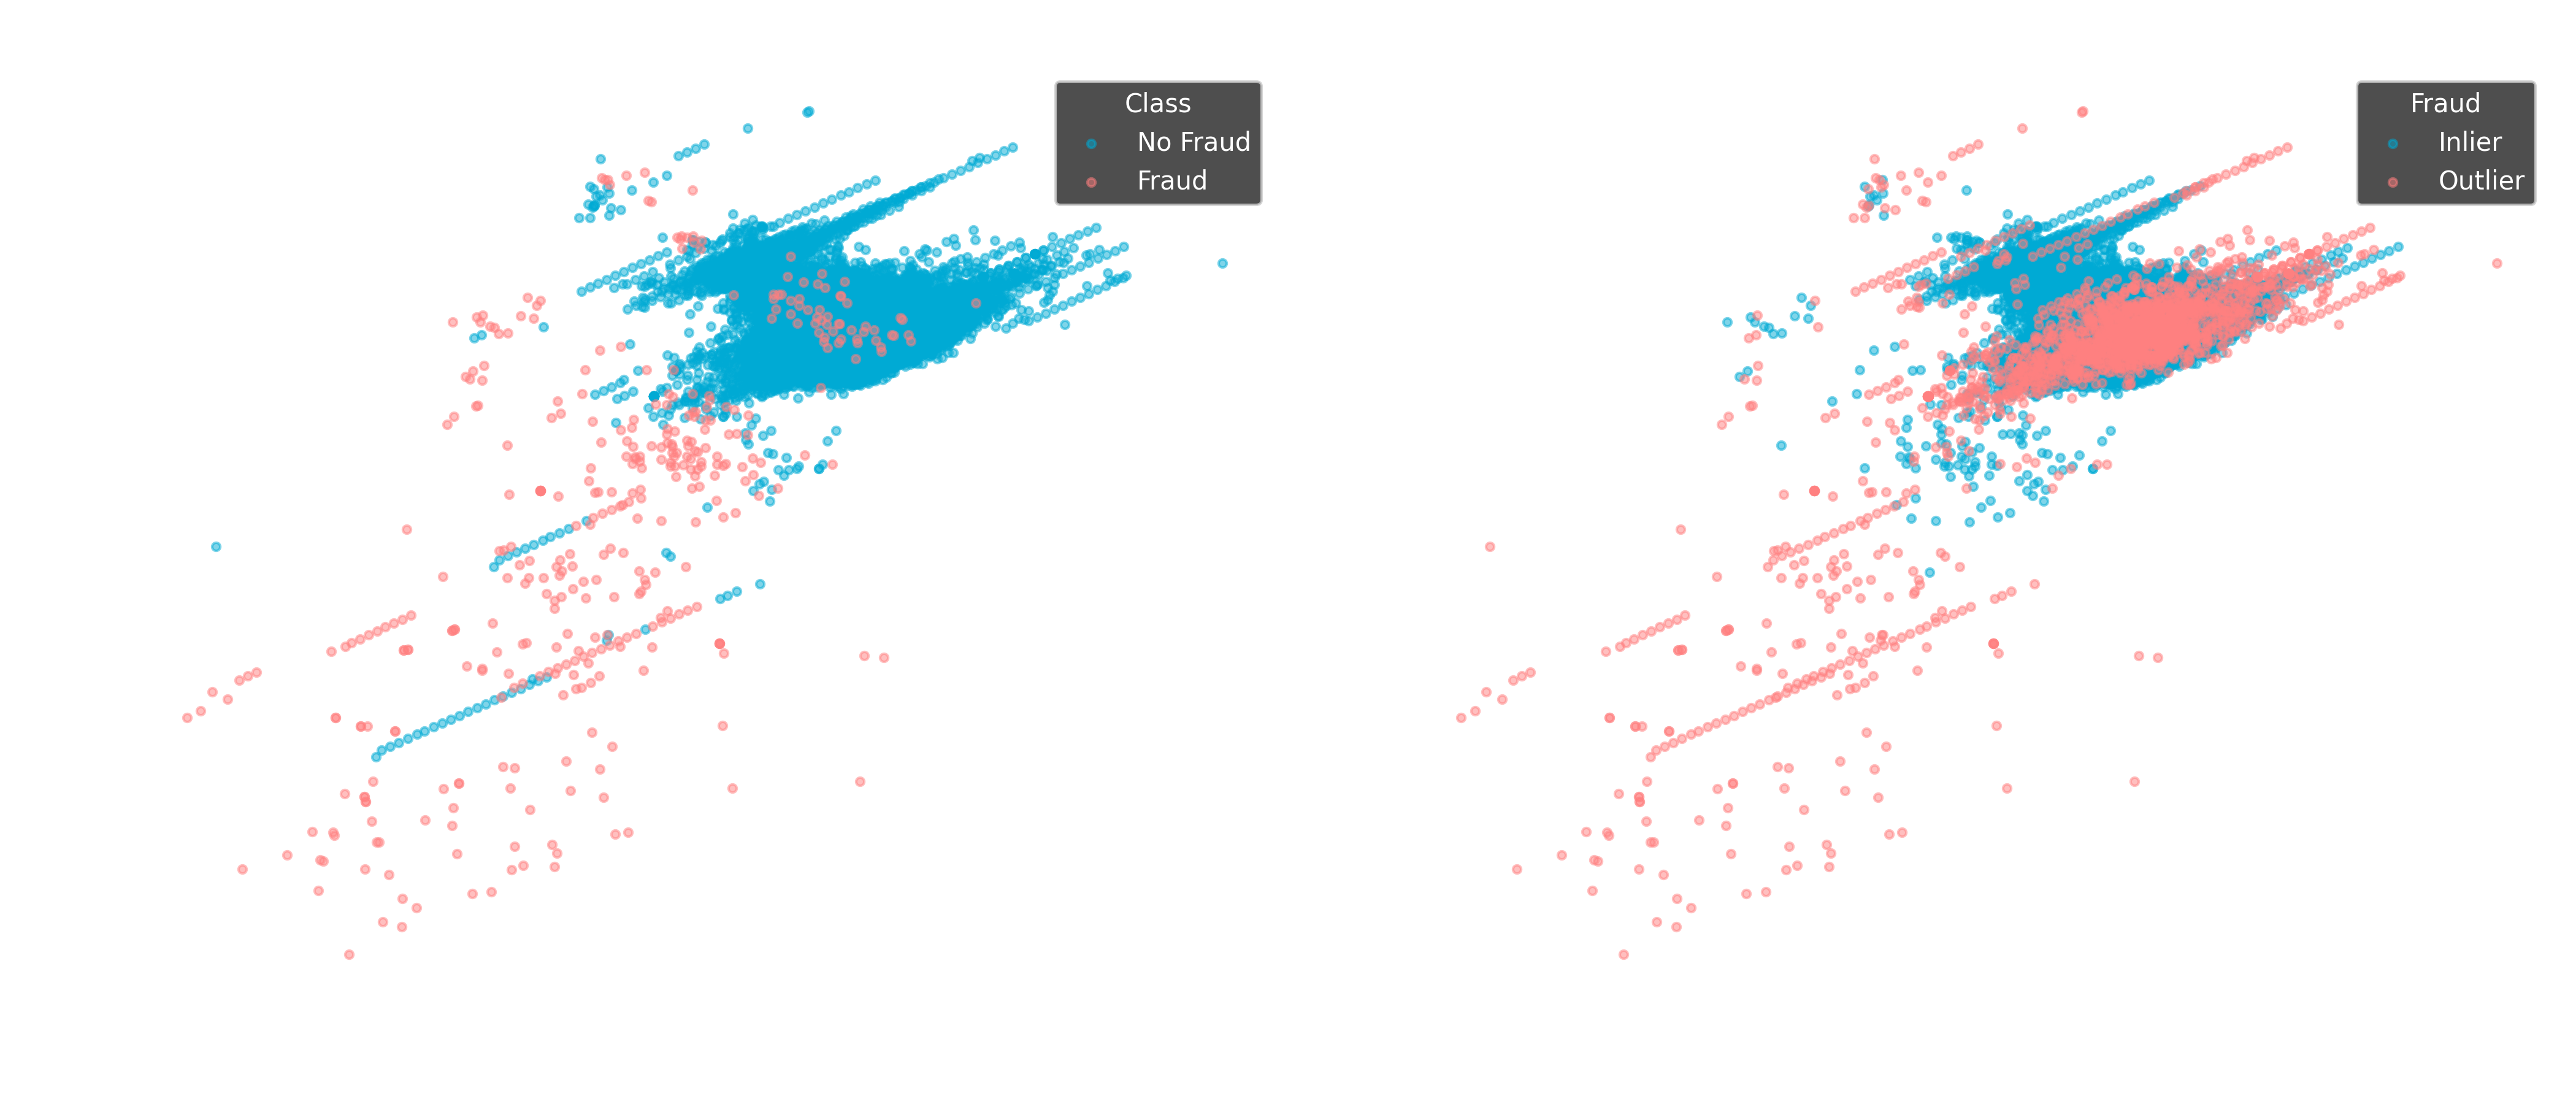
Outlier detection and Predictive maintainance
Machine learning can also be used for detecting anomalies in data. Outliers may indicate errors, fraud, or rare but significant events that require attention.
Outlier Detection Outlier detection is crucial in many domains, such as:
- Fraud detection – Identifying unusual credit card transactions that may indicate fraud.
- Network security – Detecting suspicious network activity that could be an attack.
- Medical diagnostics – Spotting rare but important health conditions in patient data.